Overview
In this document, we explain how to set up Guardrails with OpenTelemetry (OTEL) using either Grafana or a self-hosted OTEL collector. With this functionality enabled, you can measure latency of Guards, Large Language Models (LLMs), scuccess rates, and other metrics for your Guardrails-protected LLM calls.
Metrics you can capture using OTEL
This package is instrumented using the OpenTelemetry Python SDK. By viewing the captured traces and derived metrics, we're able to get useful insights into how our Guards, and our LLM apps in general perform. Among other things, we're able to find:
- Latency of Guards
- Latency of LLMs
- Success rates of Guards
- The rate at which validators Pass and Fail, within a Guard and across Guards
- Deep dives into singular guard and validator calls
Since we are using OpenTelemetry, traces and metrics can be written to any OpenTelemetry-enabled service or OTLP endpoint. This includes all major metrics providers like Grafana, New Relic, Prometheus, and Splunk.
This guide will show how to set up your Python project to log traces to Grafana and to a self-hosted OTEL collector. For other OTEL endpoints, consult your metrics provider's documentation on OTEL support.
Configure OTEL for Grafana
Grafana Cloud is a free offering by Grafana that's easy to setup and is our preferred location for storing metrics.
Get environment variables from Grafana
- Sign up with the Grafana cloud (it's free!) https://grafana.com/auth/sign-up/create-user.
- Once your account is up, create a stack.
- Navigate away to https://grafana.com/ and click the "My Account" button on the top right of the screen
- Scroll down and click on the "Configure" button in the "Open Telemetry" section of the page
- Click "generate token"
- Compile the instance ID, token, and environment variables GRAFANA_INSTANCE_ID TOKEN OTEL_EXPORTER_OTLP_PROTOCOL OTEL_EXPORTER_OTLP_ENDPOINT OTEL_EXPORTER_OTLP_HEADERS
Setup a Guard with Telemetry
- First, install the
ValidLengthguardrail from Guardrails Hub.
guardrails hub install hub://guardrails/valid_length
- Next, set up your Guard and the default tracer provided in the guardrails library. You can still use your desired validators:
main.py
from guardrails import Guard, OnFailAction
from guardrails.telemetry import default_otlp_tracer
from guardrails.hub import ValidLength
import openai


# use a descriptive name that will differentiate where your metrics are stored
default_otlp_tracer("petname_guard")

guard = Guard.for_string(
  validators=[ValidLength(min=1, max=10, on_fail=OnFailAction.EXCEPTION)],
)

guard(
  llm_api=openai.chat.completions.create,
  prompt="Suggest a name for my cat.",
  model="gpt-4",
  max_tokens=1024,
  temperature=0.5,
)
- Before running the file, make sure to set the environment variables you got from Grafana
export GRAFANA_INSTANCE_ID=
export TOKEN=

# these come from the 'copy environment variables' button
export OTEL_EXPORTER_OTLP_PROTOCOL=
export OTEL_EXPORTER_OTLP_ENDPOINT=
# IMPORTANT: Make sure to replace the space after "Basic" with "%20".
export OTEL_EXPORTER_OTLP_HEADERS=
- Finally, run the python script
python main.py
View traces
There are two ways to view traces: using the Explore tab or using the Guardrails Grafana dashboard template.
Use the Explore tab
The simplest way to do this is to go to your grafana stack and click on the "Explore tab. You should see a list of traces that you can filter by service name, operation name, and more.
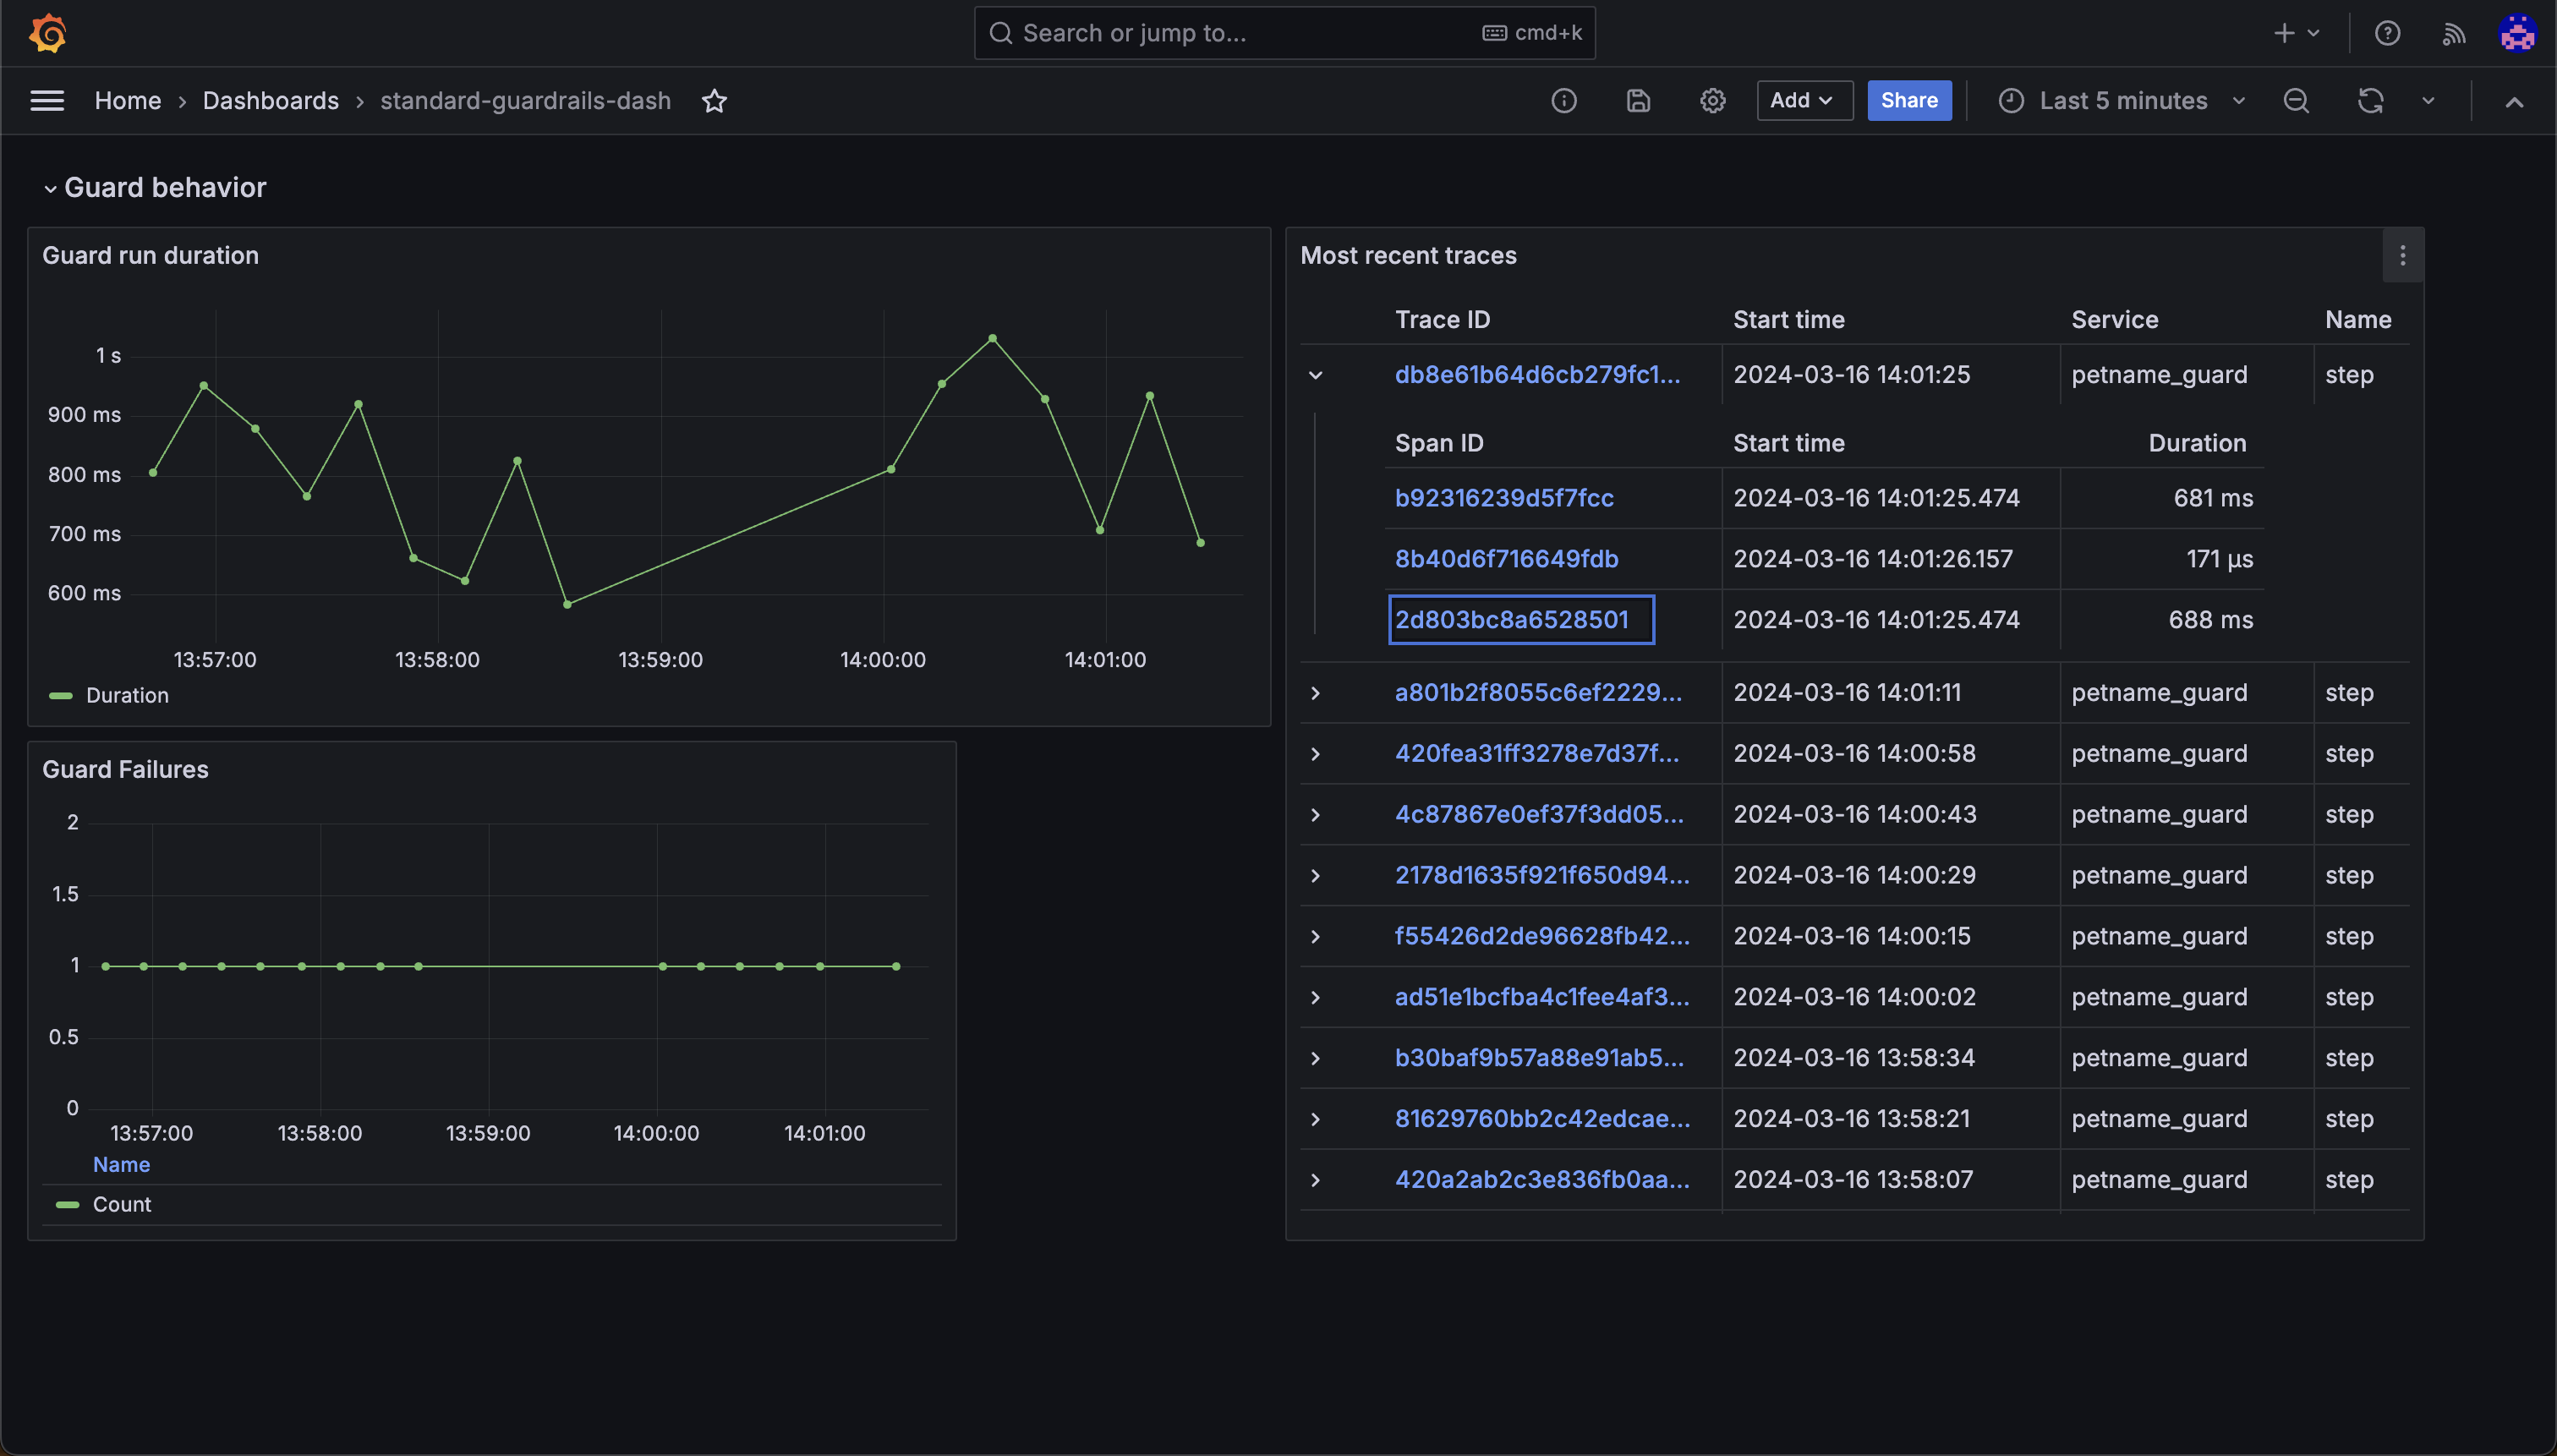
Use the Guardrails Grafana dashboard template
While this is easy to do, it's not the best way to get a big-picture view of how your guards are doing. For that, we should use the Guardrails Grafana dashboard template.
Configure OTEL for a self-hosted OpenTelemetry Collector
For advanced use cases (like if you have a metrics provider in a VPC), you can use a self-hosted OpenTelemetry Collector to receive traces and metrics from your Guard.
Standard open telemetry environment variables are used to configure the collector. Use the default_otel_collector_tracer when configuring your guard.
from guardrails import Guard, OnFailAction
from guardrails.telemetry import default_otel_collector_tracer
from guardrails.hub import ValidLength
import openai


# use a descriptive name that will differentiate where your metrics are stored
default_otel_collector_tracer("petname_guard")

guard = Guard.for_string(
  validators=[ValidLength(min=1, max=10, on_fail=OnFailAction.EXCEPTION)],
)

guard(
  llm_api=openai.chat.completions.create,
  prompt="Suggest a name for my cat.",
  model="gpt-4",
  max_tokens=1024,
  temperature=0.5,
)